Tuesday, February 28, 2017

Processing Pix4D Imagery

Pix4D is a drone photogrammetry software that uses images to create point clouds, DSMs, orthomosaics and more. It is a survey workflow that allows for a variety of professional fields such as; construction, agriculture, and real estate to access quality software for analyzable results. Users can utilize Pix4D with any camera, photo, or it's app, Pix4Dcapture, to generate data that is easily shareable. It is available online or offline so no internet connection is needed.

Pix4D FAQs


  • What is the overlap needed for Pix4D to process imagery?

It is recommended that users have at least 75% frontlap and 60% sidelap.

  • What if the user is flying over sand/snow, or uniform fields?
With snow and sand in uniform areas, 85% frontlap and 70% sidelap is recommended.

  • What is Rapid Check?
Rapid check is a fast processing method that creates a visual surface very fast but with low resolution. This is great for field workers who need a quick check to view their work.

  • Can Pix4D process multiple flights? What does the pilot need to maintain if so?
Yes, Pix4D is capable of processing multiple flights. The pilot needs to maintain the same vertical and horizontal coordinate system throughout the whole project if they wish to merge multiple flights.

  • Can Pix4D process oblique images? What type of data do you need if so?
Pix4D can process oblique images. It is recommended to take images every 5-10 degrees if doing so, as well as capturing two sets of data at different heights.

  • Are GCPs necessary for Pix4D? When are they highly recommended?
GCPs are not necessary for Pix4D, but they are highly recommended especially when a project has no geolocation

  • What is the quality report?
The quality report is the description of how the data displayed after the initial processing. It gives a summary of the entire dataset, and how good of a quality result it processed in.

Using Pix4D


Figure 1: Prompt that appears after selecting Project.

When Pix4d is opened click on Projects and then open a New Project (Figure 1). Name the project something relevant, hopefully coordinating with a naming convention, and save it where it can be found later (Figure 2). 

Figure 2: Naming convention displayed is based upon the date imagery is collected, site name, system used, flight number, and height.

From there, the "Select Images" screen opens up. At this point, all of the flight image files collected with a drone can be added. Click on the first image and then hold shift and click the last image in a folder to add all images at once. Click "Next" once this is done, review the Image Properties, and within that page select "Edit" within the camera model to change the Shutter Model to Linear Rolling Shutter (Figure 3) if the camera model used collects images this way. 


Figure 3: Changing the camera type to linear rolling shutter by editing camera model.

Click "Next" and review the Output Coordinate System page to ensure accuracy. Click Next and select the type of processing to be completed. It will be 3D Maps for most basic processing tasks. Creating a study area can be helpful to make processing faster. To do this, select "Map View" and then select Processing Area and delineate the area wanted to study. When first running the processing, only select "1. Initial Processing" to view to data's quality before the rest of the processing can occur. This will generate a Quality Report to be viewed to ensure that quality is high enough to process (Figure 4). Once this is reviewed, the point cloud and mesh, and DSM, Orthomosaic, and Index can be processed. ArcMap can be used to generate aesthetically pleasing maps.

Results


Figure 4: Litchfield Mine's flight 1 quality report. 


Flight 1 was successful in processing 68 out of 68 images in Pix4D. Each image had a median of 30,573 keypoints, which accounted for a high accuracy in stitching the photos together. No GCPs were used in creating the dataset, but the images were all georeferenced using UTM Zone 15 N.


Figure 5: Litchfield Mine's flight 2 quality report.


Flight 2 was successful in processing 87 out of 87 images in Pix4D. Each image had a median of 21,120 keypoints, which accounted for a high accuracy in stitching the photos together. Like flght 1, no GCPs were used in creating the dataset, but the images were all georeferenced using UTM Zone 15 N.


Video 1: Flyby video of Flight 1.


The flyby video shows the high quality processing that is done within Pix4D. The video displays objects on the ground in 3D with high precision. This presentation method is highly effective across a variety of professions.


Figure 6: Post-processed DSM created from Litchfield Mine flight 1.
The DSM displayed above (Figure 6) is the result of Pix4D processing a DSM and an orthomosaic (Figure 7) for the Litchfield data. The DSM is hillshaded to view the results better. This displaying of the data can be highly effective for viewing a study area's elevation from above. Each individual mound is shown by elevation with higher elevations displaying as a brighter shade of red. Some of the areas that create questions are the lines of sparsely populated high elevation values on the right, and the hook facing the west. The orthomosaic has to be consulted to view this (Figure 7).


Figure 7: Orthomosaic of images taken in flight 1 displays Litchfield Mine.


The orthosmosaic is an extremely accurate mosaic that can be used to visually identify characteristics of the mine that is not discernible in the DSM. The areas in question for Figure 6 are identifiable in this orthomosaic. The hook on the right is seen as low lying vegetation, and the line on the right id a group of trees that follow the road into the mine.


Figure 8: Post-processed DSM created from Litchfield Mine flight 2.
The DSM for flight 2 (Figure 8) is also hillshaded to display elevation values better. This image contains some errors, as the values in the area on the south east side of the image seems extremely stretched. Everything else is accurate to display elevation values.


Figure 9: Orthomosaic created from the flight 2 images. 

Pix4D created a highly accurate orthomosaic stitched together form the images provided. Each area is extremely delineateable. The trees to the bottom, the mounds in the middle, vegetation to the southwest and northeast, and water following the top of the image. The trees at the bottom explain the poor DSM quality for those pixels. Pix4D had a hard time creating proper elevation values form the varying canopy.


Pix4D Review


Pix4D is a great program for processing UAS imagery. Even those who have no knowledge of geographic skills could have a basic understanding of how to use the program. It creates high quality output with relative ease, and those who spend time getting to know how to use the ins and outs of Pix4D could create incredibly accurate photos for a variety of different professional applications. 

Monday, February 20, 2017

Constructing Maps With Pix4D Data

Introduction


  • Why are proper cartographic skills essential in working with UAS data?


Proper cartographic skills when working with UAS data are the same skills needed to create any successful map. One needs to know GIS software very well to assemble a map made with UAS imagery. Aside from the data displayed on a map, there are a few essentials that every map needs to be cartographically pleasing. Including these essentials will ensure that the maps made with UAS data can be displayed professionally.


  • What are the fundamentals of turning either a drawing or an aerial image into a map?


An aerial image is not a map without these essentials:
  • North Arrow
  • Scale Bar
  • Locator Map
  • Watermark
  • Data Sources


  •  What can spatial patterns of data tell the reader about UAS data? Provide several examples.


Spatial patterns of data can give readers an image of what resides on the earth. Agriculture, mining, and environmental uses are all available to those looking to collect aerial data. In agriculture, one can view the spatial distribution of soil composition throughout cropland to visually see where they need to spread more or less fertilizer. In mining, readers can determine the volumetrics of an open pit mine by determining the spatial distribution of quantities of remaining material. Environmentalists can use UAS data to view forest cover, and analyze how human practices affect canopies.


  • What are the objectives of the lab?


One objective of this lab is to take UAS data and put it into a Geographic Information Software (GIS) to analyze it extensively. Another objective of this lab is to discuss how to turn an aerial image into a map.


Methods


  • What is the difference between a DSM and DEM? 

A DSM is a surface model which includes everything that is returned to the UAS sensor from the gorund. It includes ground, vegetation, and human made features (Figure 1).


Digital Surface Model
Figure 1: DSM displaying tree cover (1).


A DEM is also called the bare earth model. It removes all land cover, including vegetation and human use, to display only the ground elevation (Figure 2). 


Digital Elevation Model (DEM)
Figure 2: DEM bare earth image displaying ground elevation (1).


  • What is the difference between a Georeferenced Mosaic and an Orthorectified Mosaic?

A georeferenced mosaic is an image that has been tied to the earth using other satellite images to create a stitched together image (2). An orthorectified mosaic is an image that has been corrected of any perspective distortion by stitching it together using common keypoints (2).


  • What are raster statistics? Why would one use them?
Raster statistics are the calculated statistics of the raster cell values (Figure 3). It allows ArcGIS to stretch the display of the image better. It also helps to classify different areas of the image.

Figure 3: Raster statistics calculated display a variety of stats to assist ArcGIS.

  • How does one hillshade DSM images? 

To hillshade DSM images, one can use the raster tool "Hillshade DSM". This allows ArcMap to calculate and display the hillshade of any DSM with ease.


Results & Discussion


Figure 4: Sportfield track along with all of the map essentials. 


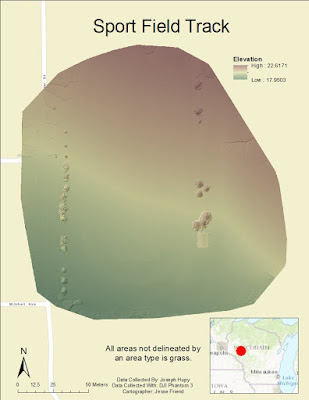
Figure 5: DSM of Sportfield track with the map essentials as well.


Figure 6: Map displaying Sportfield delineated by topography.


Figure 7: DSM image of Sportfield track displayed in ArcScene.


* What types of patterns do you notice on the orthomosaic (Figure 4)?

The grass within the track is much greener than the rest of the image. The rest of the grass is very brown. Another pattern is that all of the trees within the image are coniferous. There is also snow in the southern portion of the image.


* What patterns are noted on the DSM (Figure 5)? How do these patterns align with the DSM descriptive statistics? How do the DSM patterns align with patterns with the orthomosaic?

One pattern on the DSM is a slight rise from SW to NE in elevation. The only other distinctive features are the trees that are visible by elevation. There are not any huge outliers in return values which caused a somewhat small standard deviation. The DSM patterns align with the orthomosaic in two ways. The first is that the trees cause much more variance in the elevation features of the map. The second is that aside from the trees, the rest of the image is relatively flat.


* Describe the regions you created by combining differences in topography and vegetation.

The regions of the DSM are split into four delineated regions. The first is the trees region to section off the only vegetation. The second is the track area, which causes ripples on the DSM, so creating a region allows the reader to discern what is on the earth. The fourth is the road region. This follows the topography to the left of the field. The fourth region is grass, which is the all of the unshaded area.


* What anomalies or errors are noted in the data sets?

The only observable error is not due to user error. The top portion of the track is cut off. This is most likely caused by weather at the time of data collection.


* Where is the data quality the best? Where do you note poor data quality? How might this relate to the application?


The data quality appears to be high throughout the image. The DSM helps to display the accurate elevations of every feature captured by the UAS sensor.


Conclusion


* Summarize what makes UAS data useful as a tool to the cartographer and GIS user

UAS is a cheaper alternative than launching a satellite/ signing a contract with a satellite agency to use their data. It can be to assess temporal changes on any scale. Being a cartographer, one can utilize the technology to create visually pleasing accurate maps with the data collected.


* What limitations does the data have? What should the user know about the data when working with it.

The data does not have completely accurate elevation data. This should be noted whenever using UAS to analyze anything with elevation associated to it.


* Speculate what other forms of data this data could be combined with to make it even more useful.

This data could be combined with LiDAR data to create highly accurate, fine scale temporal maps to assess a variety of uses from agriculture to flood plains.

Citations

1. http://gisgeography.com/dem-dsm-dtm-differences/
2. https://support.pix4d.com/hc/en-us/articles/202558869-Photo-Stitching-vs-Orthomosaic-Generation#gsc.tab=0


Sunday, February 5, 2017

UAS Platform Recommendations Report

Introduction

There are countless UAS platforms available, and the market only looks to continue to grow. Navigating through all of the options available can make one feel overwhelmed and confused, but when the dust clears, there are a few choices that stand above the rest. Searching for the right vehicle can be a time consuming task, and this report looks to address that. As one searches, they may notice that there are certain tiers of choices that separate the available drones: the lower end drones mostly available for short flight hobyyists, mid-level commercial drones that are available for basic consulting processes, and high end commericial drones that will accomplish the most complex of tasks. Throughout this report, the different tiers of choices will be highlighted for their pros and cons, as well as explaining the different uses of each.

Tiers


Hobby/ Low Level Commercial


DJI Phantom 4 Quadcopter Pro $1,429


Figure 1: DJI Phantom 4 Quadcopter


i. Sensors

    The DJI Phantom 4 Quadcopter Pro+ is equipped with a 20 megapixel sensor capable of shooting 4K/60fps HD video. This equipment gives users high end video to use for either professional quality video edits, or low commercial visual analyzing of agriculture or urban landscapes. This would not be a good choice for individuals looking to do quality surveys with a UAS.
   
ii. Mission Planning Software

    The software included with the DJI Phantom 4 is the DJI Go App. It is available on the App Store or on Google Play. This app is very robust, and is intended mostly for professional photographers looking to create stunning shots with their Phantom 4. It has a variety of settings and tools that allows users to create very well produced images or videos with their unit.

iii. Range

    The range of the Phantom 4 is 3.1 miles in optimal conditions. This is a good range considering the price.
   
iv. Flight time
    Each battery for the system is rated at 28 minutes. Users report much less, something along the lines of 20-23 minutes. Most owners end up buying 3-4 batteries to complete a flight time of around 45 minutes. This is very poor for anything beyond basic imaging flights, and does not make it a viable options for any type of survey work.
 
v. Distinctive characteristics/ Bottom Line

    One very compelling case for the DJI Phantom 4 is that it is very easy to fly. New users will be able to pick up the vehicle and learn it with no previous flight experience. Another characteristic is the video quality. The camera collects extremely clear 1080p video and 4K images that are great for anything involving any sort of professional photography mission. The price is also very good for an entry level drone. The basic version of this system can be had for less than $1,000. It is capable to do very basic visual commercial work, however if you wanted to do any sort of DTM, orthomosaic, or any sort of measurements, you would need to go to one off the next two tiers up from this.


Mid-Level Commercial


Altavian F7200 $15,180


Figure 2: Altavian F7200 in launch.


i. Sensors

    The Altavian F7200 does not have any sensors built into the system. This does not detract from the overall quality though, as the sensors offered by Altavian are very high quality. The suggested sensor to attach to the F7200 is the Fusion MP22. It collects 3D data at 1 in resolution, and also collects GPS data at sub centimetric data.  Versions of the Fusion MP22 also have NIR band image capturing available.

ii. Mission Planning Software

    Flare GS10 offers a very robust mission planning software. It utilizes a radio modem to use the F7200 from the ground. Once the modem is plugged into any computer, the software can be installed and the system is ready to go. The battery can last over 8 hours of uninterrupted use.

iii. Range

     The range of the Altavian F7200 is over 3 miles. This is very good and can allow users to survey a whole agricultural field or survey a whole plot of land with ease.

iv. Flight time

    One of the major benefits of a fixed wing platform is the flight time. Because the F7200 can depend on the wings to glide, it can utilize this technology to extend the flight time to 90 minutes. This is extremely beneficial, and is one of the major reasons that this system is fantastic to collect any UAS data.

v. Distinctive characteristics/ Bottom Line

    One of the very interesting characteristics of this unit is that the F7200 can launch from a hand. This allows a field worker to use this vehicle in any environment that has at least a 10x30 m area for soft landing. The unit also has a hands on comprehensive training included, which can improve any new to intermediate users skills. The F7200 has a nine foot wingspan and can work in winds up to 15 m/s. There is an amphibious version also available for purchase for landing in water bodies. Because of the flight time and other characteristics, this unit is very capable of completing most data collection from the air. If a company is in need of a quality UAS without breaking the bank, this unit would be one of the best choices available.


High-Level Commercial


Topcon Sirius Pro $53,000


Figure 3: A field worker preparing the Sirius Pro.

i. Sensors
    The Topcon Sirius Pro boasts a 16MP CMOS sensor ad a Fujifilm XF 18mm f/2 R lens with a fixed focal length which increases the post-processing quality. There is also an NIR option like the Altavian F7200, which allows the user to conduct relative NDVI computations.

ii. Mission Planning Software
    The MAVinci software is an incredibly intuitive flight planning software that is essentially just a point and click program. Once you select the area of interest and the ground Sampling Distance, the software automatically calculates the optimal flight plan, which can be adjusted mid-flight if need be. It also gives options for mountainous area.

iii. Range
   Like the other two UAS devices mentioned above, the range is around 3 miles. This because of the FCC regulations on line of sight of the aircraft limit aircraft to 5km, which translates to about 3 miles. By establishing the radio link as just over three miles, the companies can help users to stay out of trouble, and harms way to their vehicle, by remaining within the line of sight regulations.

iv. Flight time
   
    The flight time on this device is 50 minutes. This is significantly less than F7200, however the reason behind the shortened flight time is because of the camera's extra weight added.

v. Distinctive characteristics/ Bottom Line

    Like the F7200, the Sirius Pro offers an incredibly easy hand launch with no need for a catapult. One of the major features of the Sirius Pro is the high accuracy RTK stream. This eliminates need for GCPs in post production and saves an immense amount of hand work by calculating extremely accurate GPS location at all times and pinning it to the earth. The Sirius Pro can also fly comfortably in up to 31 mph and can take gusts up to 40 mph. All of these combinations make the Topcon Sirius Pro one of the more desirable UAS units out there. It can handle anything for forestry surveying to as-builts of cities. If this thing is in the budget, it would be worth it to take a hard look at it.